
If your organization generates $20–30 million in annual net patient revenue, even small revenue cycle gaps can materially affect margins. Healthcare leaders typically track metrics such as denial rates, days in accounts receivable (AR), and net collection rates to evaluate performance.
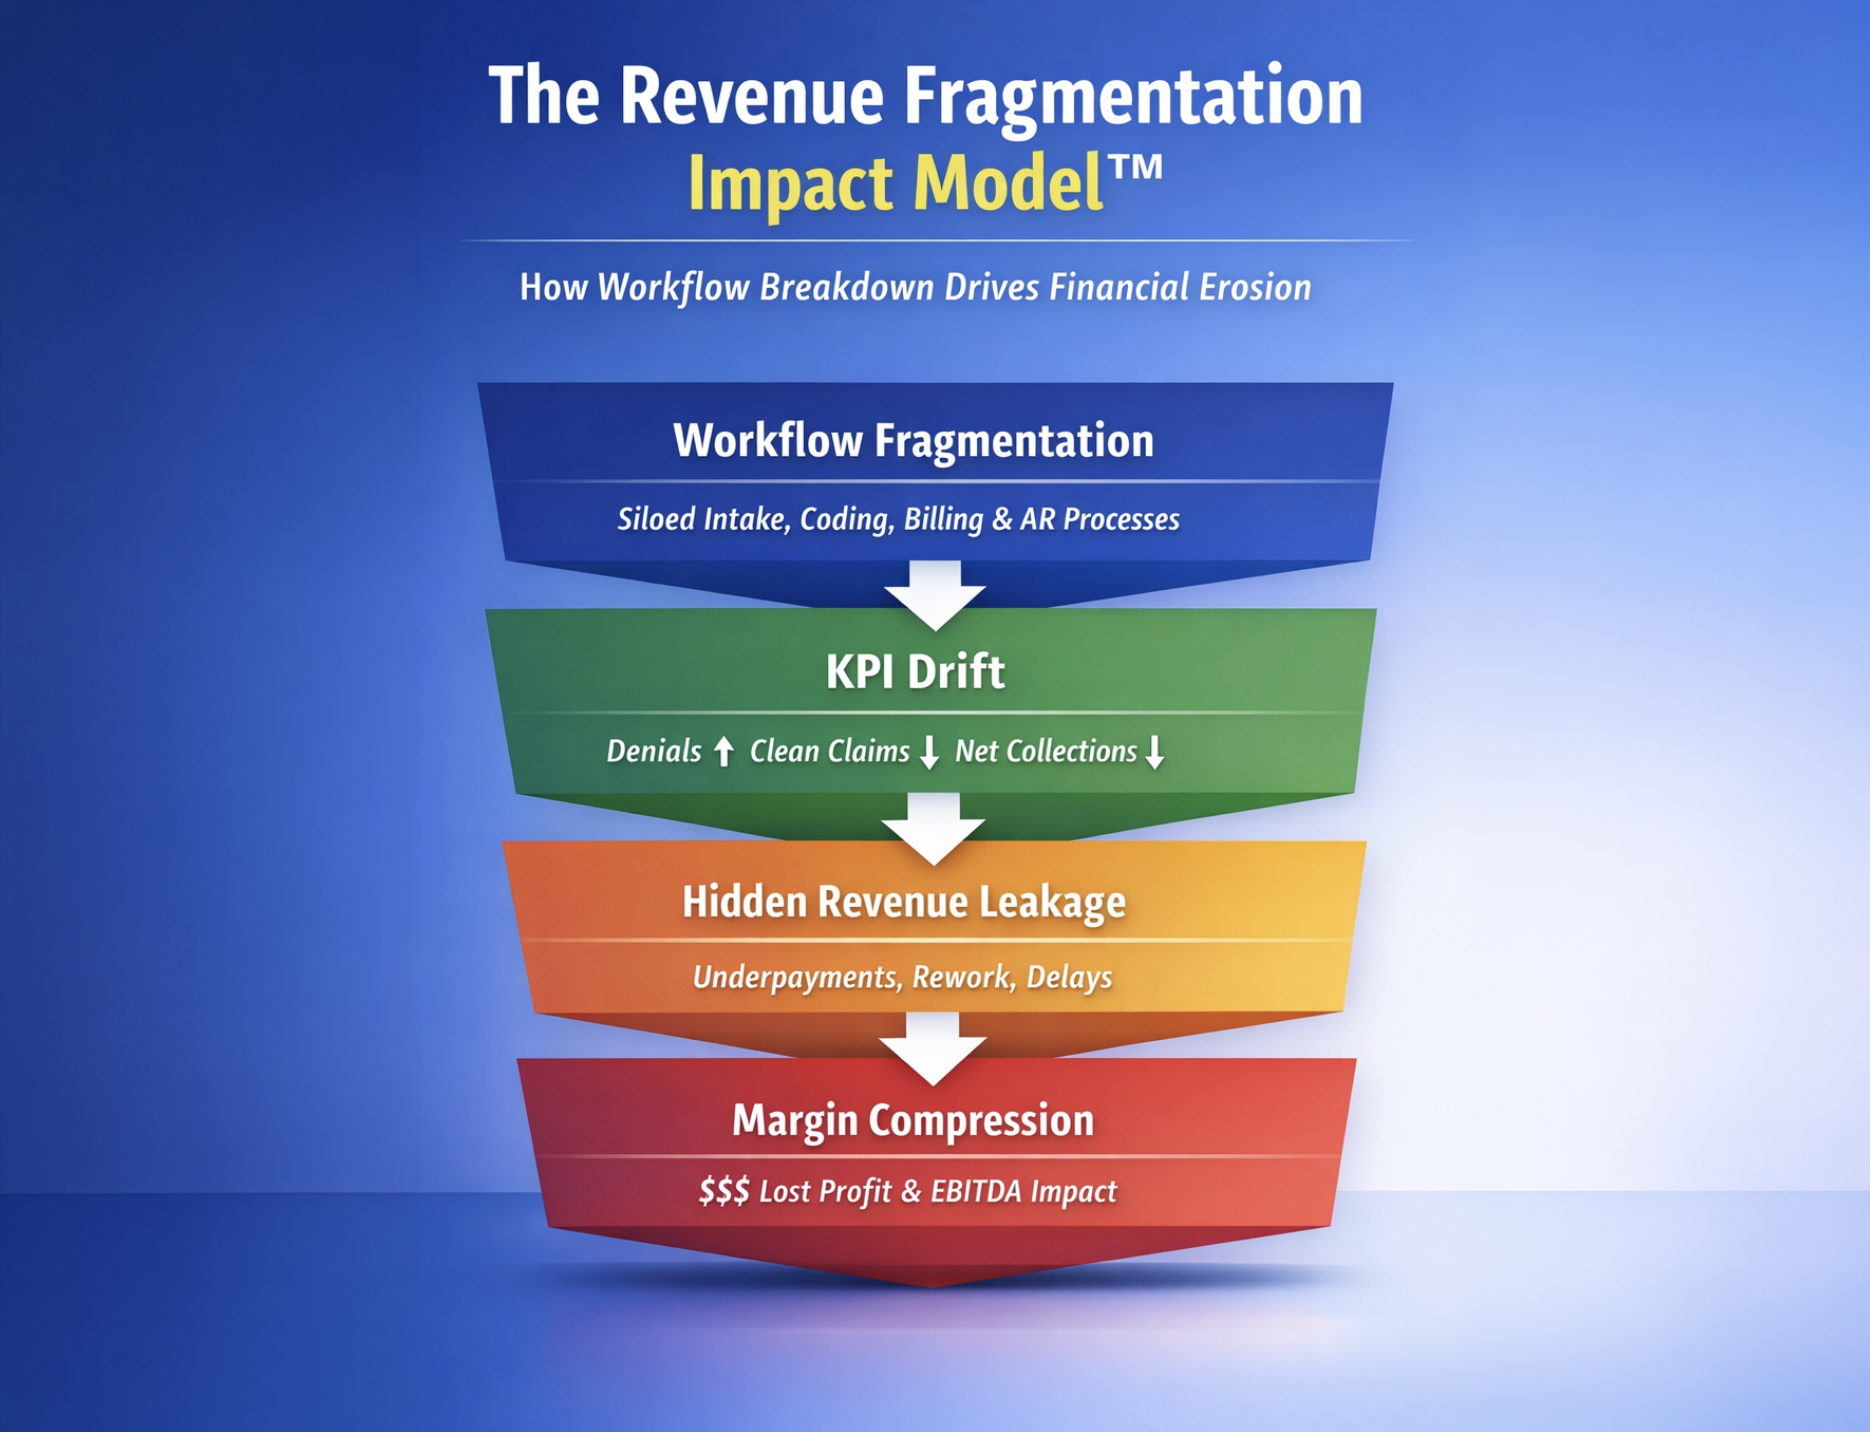
However, revenue leakage rarely originates from one metric failure. In most organizations, it is due to fragmentation across the revenue cycle. Over time, that siloed workflows can quietly erode 5–10% of collectible revenue each year.
This estimate reflects the cumulative impact of eligibility gaps, coding variance, recurring denials, underpayments, and inefficient AR follow-up. Each of these issues is independently documented in national benchmarking studies from organizations such as the Healthcare Financial Management Association and the Medical Group Management Association.
What a 5–10% Loss Looks Like
Industry research suggests that revenue leakage across healthcare organizations often ranges from 3–5% of net revenue, with additional exposure created by underpayments and documentation gaps. Analyses discussed by the Healthcare Financial Management Association highlight how these issues accumulate across the revenue cycle.
In some outpatient environments, documentation and coding variance alone have been associated with 5–10% revenue loss without major denial spikes. This makes the financial impact difficult to detect through traditional dashboards.
Consider an organization generating $25 million in annual net patient revenue:
- A 5% erosion represents approximately $1.25 million in lost collectible revenue
- A 10% erosion represents roughly $2.5 million in preventable loss
This is not operational noise. It represents a meaningful reduction in financial capacity that can affect staffing, technology investment, and long-term strategy.
Why Process Misalignment Matters
Siloes becomes clearer when viewed against industry benchmarks.
According to the Medical Group Management Association and the Healthcare Financial Management Association, high-performing healthcare organizations typically maintain denial rates at or below 5%. Many provider groups operate closer to 8–10%, which signals operational breakdowns rather than isolated payer behavior.
A strong net collection rate should generally exceed 95% of collectible revenue. This metric reflects how effectively organizations convert billable services into realized cash after contractual adjustments. When performance falls below this threshold, the cause is often process misalignment across intake, coding, billing, and AR follow-up.
Clean claim rate benchmarks reinforce the same pattern. Industry best practice targets 95% or higher first-pass claim acceptance, meaning claims are processed without edits or rejections. Even a small deviation below that benchmark can produce thousands of additional claims requiring rework, appeals, and delayed reimbursement.
When these indicators drift together, the issue is rarely staffing levels or patient volume. It usually reflects structural fragmentation across the revenue cycle.
Where Revenue Erosion Happens
Revenue leakage rarely results from one dramatic failure. It usually develops across predictable pressure points where accountability and feedback loops are weak.
- Front-End Breakdowns: Eligibility and Authorization
Eligibility verification and prior authorization are among the most important control points in the revenue cycle. When these functions are inconsistent or poorly integrated with billing systems, incorrect payer information enters the workflow before services are delivered.
This creates downstream denials that are entirely preventable.
HFMA shows that nearly half of claim denials originate from front-end issues, including eligibility errors and missing authorizations. When intake controls are weak, organizations absorb unnecessary rework, delayed reimbursements, and administrative costs.
- Documentation and Coding Variability
Even when claims are not denied, reimbursement may still fall below full contractual value.
When documentation and coding teams operate without structured feedback loops, several issues can occur:
- Modifiers are omitted
- Documentation does not fully support acuity levels
- Charge capture is incomplete
In these cases, the claim is processed and paid. However, it may be reimbursed at a lower level than justified.
Industry commentary referenced in benchmarking research from the Medical Group Management Association notes that coding inconsistencies remain a persistent contributor to revenue leakage across physician practices. Because these claims are technically “clean,” the financial impact often remains invisible in denial dashboards.
- Denial Recurrence Without Root-Cause Elimination
Denials create both financial loss and operational burden. Each denied claim requires manual intervention, investigation, and resubmission.
Benchmark data discussed in industry analyses and payer reporting by organizations such as Change Healthcare indicates that average denial rates across providers frequently exceed best-practice thresholds, often reaching 8% or more.
When denial management focuses primarily on appeals rather than prevention, recurring denial categories persist. This increases cost-to-collect and extends reimbursement timelines.
Without a closed feedback loop that links denial patterns back to front-end and coding processes, the same errors continue to generate avoidable revenue loss.
- Underpayments and Contract Variance Exposure
Underpayments are one of the least visible sources of revenue leakage.
Because these claims are technically paid, they rarely appear in denial tracking systems. If reimbursement is not validated against payer contract terms, payment discrepancies may accumulate unnoticed.
Industry commentary and revenue cycle studies referenced by the Healthcare Financial Management Association highlight that organizations without systematic variance monitoring can lose high single-digit percentages of revenue to underpayments alone.
For leadership teams, this creates a misleading sense of financial stability while margins gradually compress.
- Inefficient Accounts Receivable Prioritization
Accounts receivable performance is often measured through days in AR, but this metric alone does not reflect operational effectiveness.
When high-value claims are not prioritized based on financial exposure, payer behavior, and aging risk, working capital remains unnecessarily constrained.
Top-quartile organizations identified in Medical Group Management Association benchmarking studies demonstrate faster cash velocity by segmenting AR strategically. Follow-up activities are aligned with claim value, payer patterns, and reimbursement probability.
Fragmented workflows treat all claims equally. Integrated systems prioritize claims based on financial impact.
The difference directly affects liquidity.
The Structural Pattern
Across these five areas, the pattern is consistent.
Industry benchmarks do more than measure performance. They reveal whether operational systems are properly aligned.
When denial rates exceed 5%, when net collection rates fall below 95%, or when reimbursement does not match contractual value, the issue is rarely isolated.
It is usually structural fragmentation.
Revenue loss rarely occurs because individual teams fail. It happens when the systems connecting those teams lack coordination and governance.
A Focused 30-Day Diagnostic
Organizations do not need a multi-year transformation program to identify structural risk. A disciplined 30-day diagnostic review can reveal where leakage occurs.
Key areas to evaluate include:
- denial recurrence patterns by root cause
- authorization lapse frequency
- underpayment sampling against payer contracts
- charge lag variance across departments
- revenue-per-encounter trend analysis
If recurring gaps appear across these indicators, the issue is systemic rather than incidental.
Final Perspective
Revenue cycle management should function as a financial control system, not simply a billing operation.
Benchmarks published by organizations such as the Healthcare Financial Management Association and the Medical Group Management Association provide clear performance thresholds. The strategic question for leadership is whether internal workflows consistently align with those benchmarks.
Fragmentation rarely produces a sudden crisis. Instead, it reduces revenue gradually through small but persistent operational gaps.
In an environment of tightening reimbursement, protecting that 5–10 percent of revenue often determines whether an organization operates from financial stability or constraint.
FAQ’s
2. What is the most common operational cause of revenue leakage in healthcare revenue cycles?
Front-end breakdowns in eligibility verification, patient registration, and prior authorization remain the most common sources of preventable denials and reimbursement delays.
3. Why do denial rates remain high even with a dedicated denial management team?
Denial rates remain elevated when organizations focus on appealing denied claims rather than addressing the upstream causes of those denials.
4. Can revenue loss occur even when claims are approved and paid?
Yes, revenue loss can still occur when documentation gaps or coding inconsistencies lead to undercoding or incomplete charge capture.
5. Why are payer underpayments difficult to detect?
Underpayments are difficult to detect because claims are marked as paid even when reimbursement falls below contractual expectations.
6. Which metrics should leadership monitor to detect revenue cycle fragmentation early?
Leadership should monitor denial rate, clean claim rate, net collection rate, revenue per encounter, and payer variance patterns simultaneously to detect structural gaps.
7. How significant can revenue leakage become for mid-sized healthcare organizations?
For organizations generating $20–30 million in annual net patient revenue, even a 5–10% leakage can translate into seven-figure financial exposure.
8. How do recurring denial categories indicate structural revenue cycle issues?
Recurring denial categories typically signal RCM process breakdowns in eligibility, documentation, or coding workflows rather than isolated payer decisions.
9. Why does accounts receivable prioritization affect revenue cycle performance?
Accounts receivable performance improves when claims are prioritized based on financial exposure, payer behavior, and aging risk instead of uniform follow-up.
10. How frequently should healthcare organizations assess revenue cycle performance?
Healthcare organizations should perform structured revenue cycle diagnostics periodically or whenever key metrics begin to drift from benchmark ranges.

 Prev
Prev